1
2
3
4
5
6
7
8
9
10
11
12
13
14
15
16
17
18
19
20
21
22
23
24
25
26
27
28
29
30
31
32
33
34
35
36
37
38
39
40
41
42
43
44
45
46
47
48
49
50
51
52
53
54
55
56
57
58
59
60
61
62
63
64
| from pyecharts.charts import Bar, Timeline
from pyecharts.options import *
from pyecharts.globals import ThemeType
data_lines = [
'1960,美国,5.43E+11', '1960,英国,73233967692', '1960,法国,62225478000', '1960,中国,59716467625',
'1961,美国,5.63E+11', '1961,中国,50056868957', '1961,英国,7.77E+10', '1961,法国,6.75E+10',
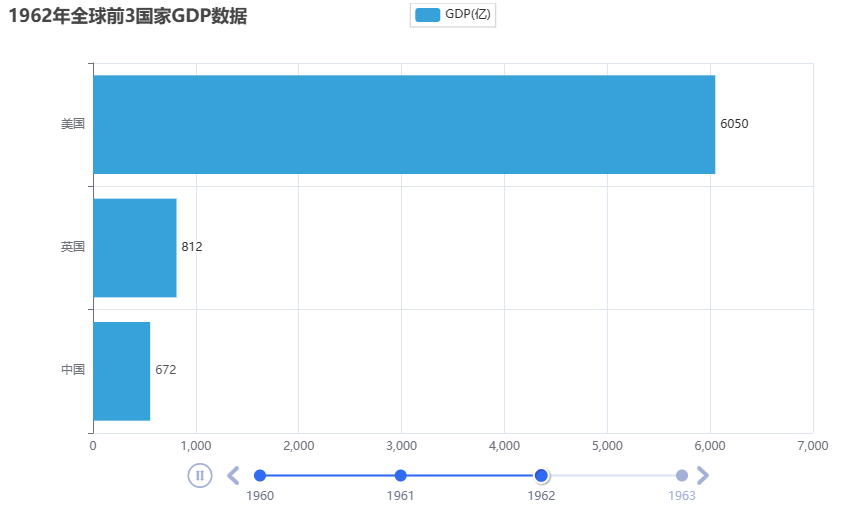
'1962,美国,6.05E+11', '1962,中国,6.72E+10', '1962,英国,8.12E+10', '1962,印度,42161481858',
'1963,美国,6.39E+11', '1963,中国,5.07E+10', '1963,英国,8.66E+10', '1963,法国,8.48E+10',
]
data_dict = {}
for line in data_lines:
year = int(line.split(",")[0])
country = line.split(",")[1]
gdp = float(line.split(",")[2])
try:
data_dict[year].append([country, gdp])
except KeyError:
data_dict[year] = []
data_dict[year].append([country, gdp])
timeline = Timeline({"theme": ThemeType.LIGHT})
sorted_year_list = sorted(data_dict.keys())
for year in sorted_year_list:
data_dict[year].sort(key=lambda element: element[1], reverse=True)
year_data = data_dict[year][0:3]
x_data = []
y_data = []
for country_gdp in year_data:
x_data.append(country_gdp[0])
y_data.append(country_gdp[1] / 100000000)
bar = Bar()
x_data.reverse()
y_data.reverse()
bar.add_xaxis(x_data)
bar.add_yaxis("GDP(亿)", y_data, label_opts=LabelOpts(position="right"))
bar.reversal_axis()
bar.set_global_opts(
title_opts=TitleOpts(title=f"{year}年全球前3国家GDP数据")
)
timeline.add(bar, str(year))
timeline.add_schema(
play_interval=1000,
is_timeline_show=True,
is_auto_play=True,
is_loop_play=True
)
timeline.render("1960-1963全球GDP前3国家.html")
|
